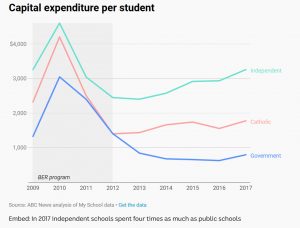
School infrastructure spending is clearly explained in this new interactive infographic showing 8,500 Australian schools ranked from highest to lowest on the income ladder, according to their average yearly income between 2013 and 2017. Circles are sized by total spend on new facilities and renovations in that period. Bigger circle=Bigger capital expenditure.

Educators will often say it’s not the buildings, it’s what done inside them so we would encourage parents to ask the school/s they are considering for their child what is done inside the new Science/Arts/Performance/Sports etc… space.
School infrastructure is expensive. Before deciding on a school, parents may like to ask how new building infrastructure is planned and funded? Is it through a capital building grant from Government, did/do they borrow funds, did/do they call on the community through a fundraising appeal? Ask for the last five years of fee rise percentages – this may show a trend – is the fee increase increasing year on year to fund all the new work?
Most importantly, ask what correlation the new infrastructure has had on results or is expected to have? In other words, how will it provide a gain in teaching and learning?
Parents can also ask about the diversity of the school population; the ability to work with diverse teams of people is seen as a key 21st century goal by prospective employers. A school with a narrow population, one that ‘looks like us’, may not provide the best long term outcomes for your child.
